And at the risk of killing the momentum...
I just picked up a little green book called “Taguchi Techniques for Quality Engineering” which is about an influential japanese gentleman who proposed a new measure of product quality. For me at least, it seems to explain why everything in japan is so dern well made. Basically, he thinks that the quality of a product must be measured as the total cost to society. If customers are unsatisfied with their products, or something breaks, then the cost of the product has risen, and the quality has gone down. The best products are those with the lowest social cost. He has graphs, and boy, they are something. (Sorry about the blur, nothing will take the vaseline off my lens, not even lemon juice.))
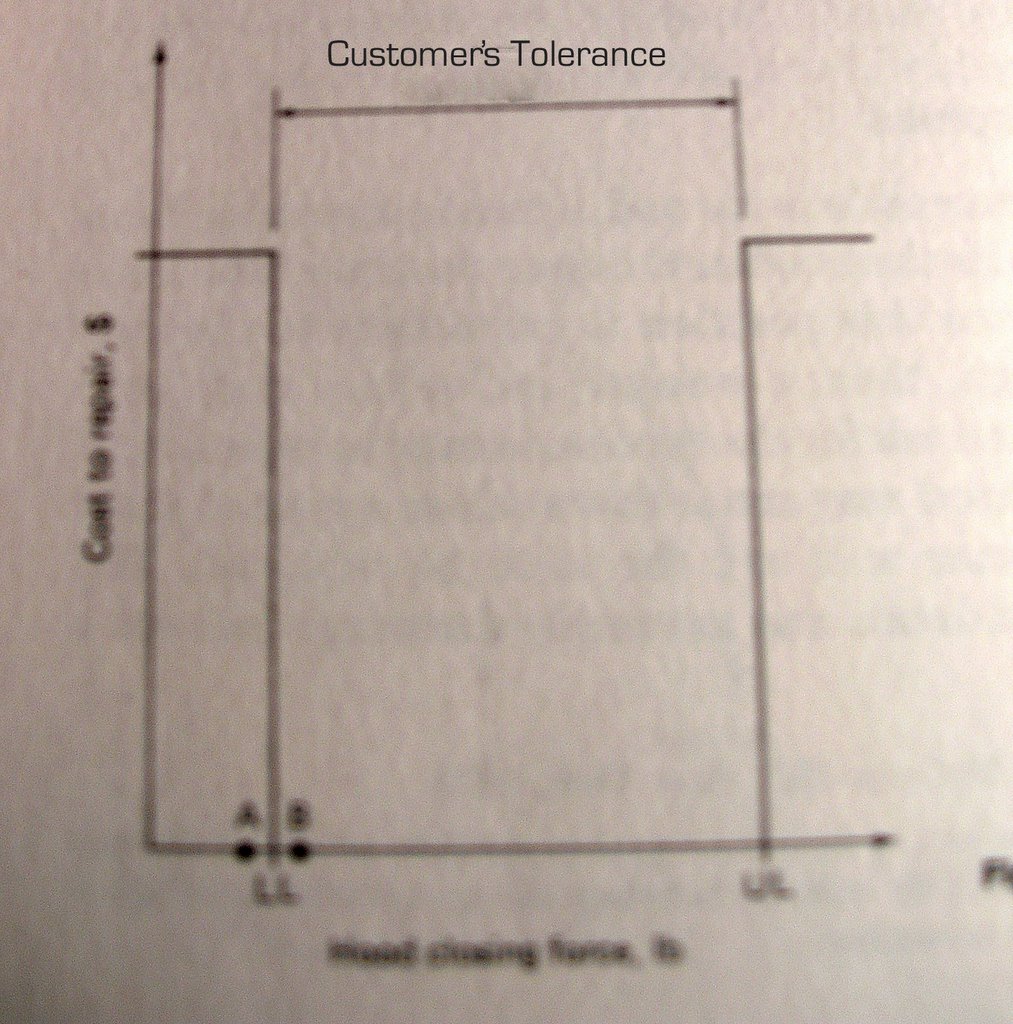
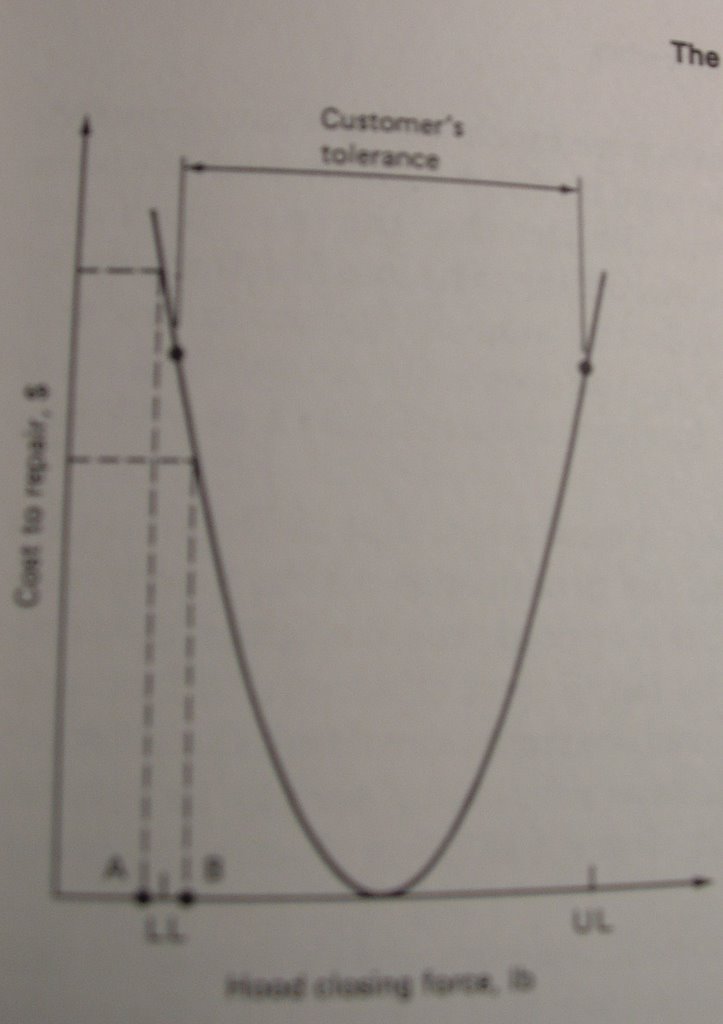
In this graph the “goalpost” (American) method is used to measure quality. A goal kick is good as long as it passes through any part of goalpost. As long as a product meets the companies specifications (set between Lower Level and Upper Level) it is judged to be of quality, even if it is in the customer’s high or low tolerance range. The example is a car hood’s closing mechanism. If it is too tight, it will be hard to operate; too loose and i t would not stay open, necessitating a repair, and thus a incurring a cost. (X-axis is cost to repair, Y is hood closing force)
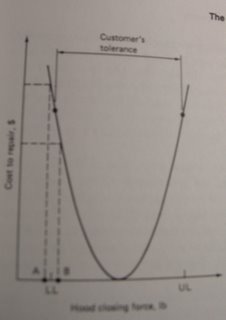
The more accurate graph is this parabolic one, which reflects the higher costs of a product which is out of nominal quality range.
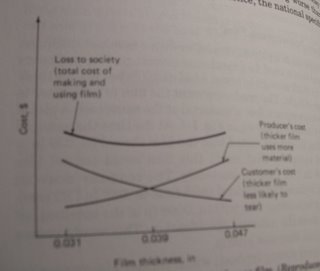
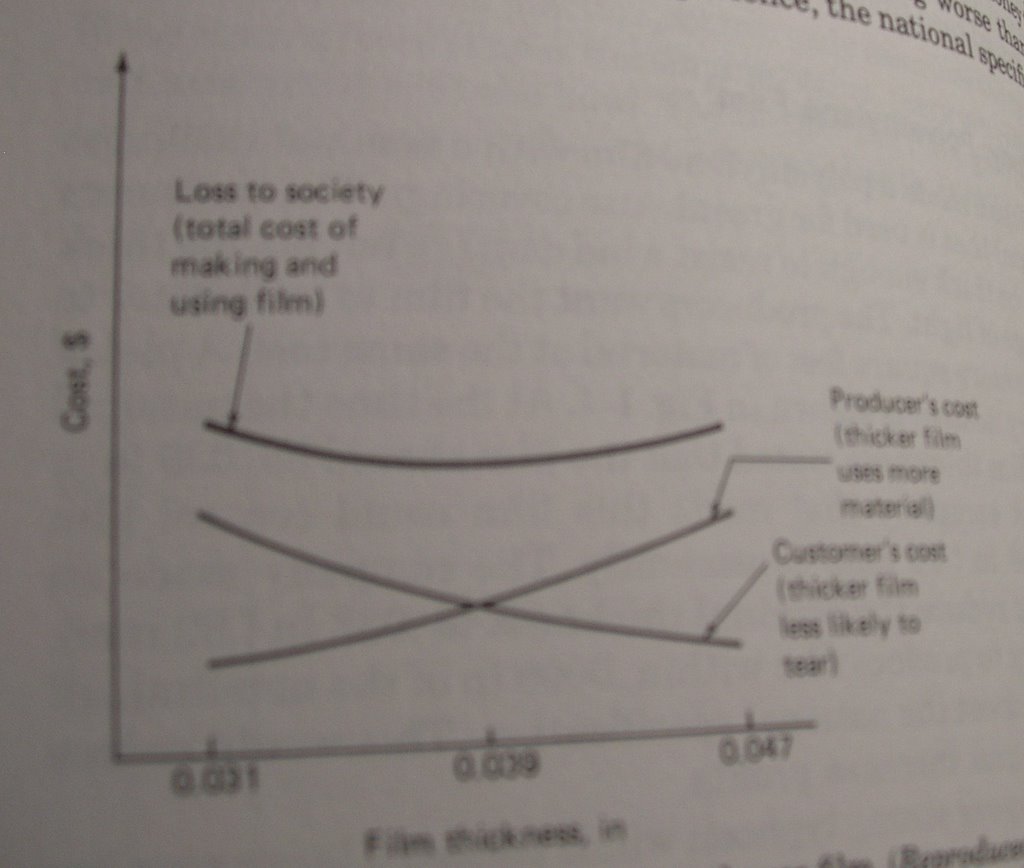
And this graph explains the famous “Loss Function” (featured on the cover). The example is greenhouse film. (Y-axis is cost, X-axis is thickness) Thicker film results in higher costs to the manufacturer, but lower costs to the customer. Thinner film is just the opposite. Taguchi proposes that the optimum quality is indicated by the lowest point in the graph of their sums, seen above the two intersecting lines. In other words, high quality is cheaper than low quality.
In this graph the “goalpost” (American) method is used to measure quality. A goal kick is good as long as it passes through any part of goalpost. As long as a product meets the companies specifications (set between Lower Level and Upper Level) it is judged to be of quality, even if it is in the customer’s high or low tolerance range. The example is a car hood’s closing mechanism. If it is too tight, it will be hard to operate; too loose and i
 t would not stay open, necessitating a repair, and thus a incurring a cost. (X-axis is cost to repair, Y is hood closing force)
The more accurate graph is this parabolic one, which reflects the higher costs of a product which is out of nominal quality range.
And this graph explains the famous “Loss Function” (featured on the cover). The example is greenhouse film. (Y-axis is cost, X-axis is thickness) Thicker film results in higher costs to the manufacturer, but lower costs to the customer. Thinner film is just the opposite. Taguchi proposes that the optimum quality is indicated by the lowest point in the graph of their sums, seen above the two intersecting lines. In other words, high quality is cheaper than low quality.
posted by keith at
4:00 PM
4 Comments
![]()